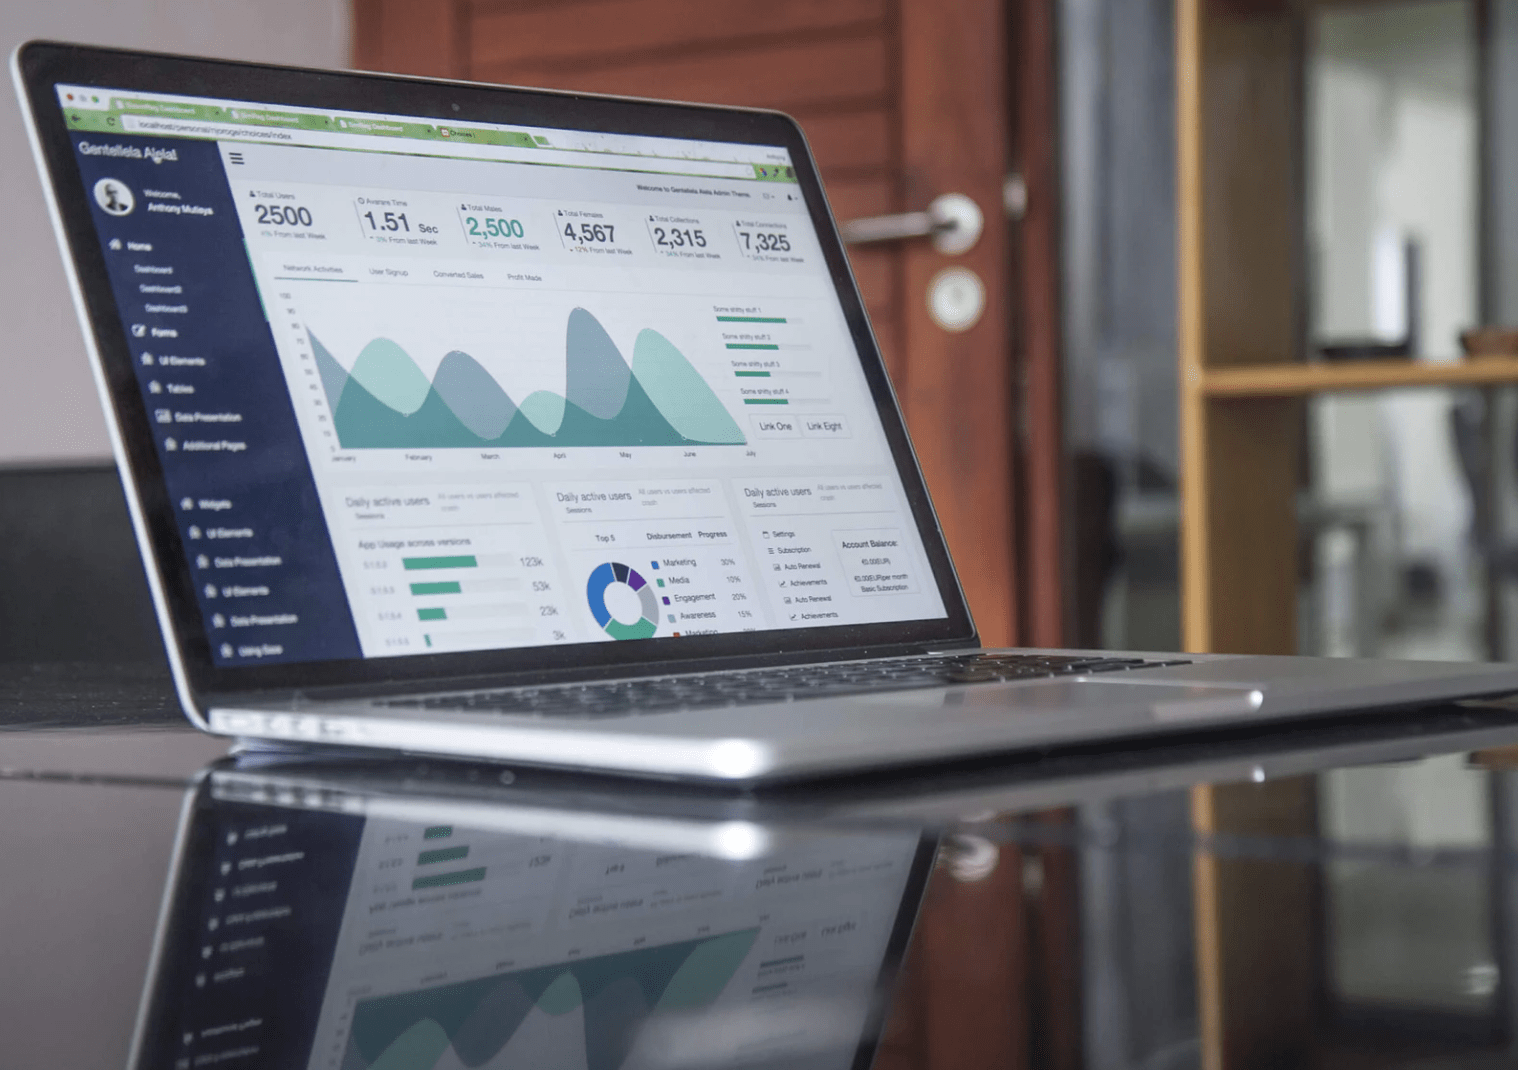
The Power BI dashboard is a data visualization tool that displays key performance indicators (KPIs), metrics, business data analytics, and other key data points on a single screen for a team, department, process, or organization. Interactive dashboards let you measure and monitor metrics and improve organizational visibility into performance in real-time. Dashboards gather data from diverse data sources to provide a one-stop reporting interface, which reduces the amount of effort and time you need to compile reports, sign into multiple analytics services, and share data with everyone in the business. They are critical tools for companies to derive instant insights from their ever-growing storehouses of big data and to assist in better data analysis and decision-making. There are 3 types of Power BI dashboards that you can use: operational, strategic, and analytical dashboards. Let us explore each one in detail to understand how they might meet your business’ objectives:
Operational Dashboards
An operational Power BI dashboard is a reporting tool that monitors business processes and tracks the current performance of critical KPIs and key metrics for a business. Data for this type of dashboard is time-sensitive, so these dashboards are largely used to track the progress made towards a goal or target on a daily basis. The chief users of this type of dashboard are business and operations managers who need to monitor and analyze company activities for a given business area in real-time. Overall, operational dashboards improve the managers visibility into multiple applications and systems on a consistent basis.
Strategic Dashboards
A strategic Power BI dashboard is a reporting tool that monitors the top-line organizational KPIs typically used by executives and are employed to summarize performance over a set period of time. Although it is not as time-sensitive as operational dashboards, it needs to be updated frequently enough for business value to still be gained. A strategic Power BI dashboard monitors the strategies employed by a company long-term with the help of crucial success factors, such as achieving KPI targets. They are usually used by senior-level managers and are usually complex in their creation as they are needed to make decision that impact the entire enterprise.
Analytical Dashboards
An analytical Power BI dashboard is a reporting tool that is used strictly by business analysts or database analysts to analyze a large volume of data to provide support to executives using historical data exclusively. Analysts can use these dashboards to identify trends, develop hypotheses, predict outcomes, generate targets, and compare the effect of one variable on another, say the effect of greater call volumes on direct sales. Because the information presented is highly technical in nature, only users that have a high level of understanding can isolate insights. These insights can then be incorporated into future business intelligence strategies. An analytical Power BI dashboard often includes advanced Business Intelligence features that can drill-down certain sets of data or enable querying. These dashboards use historical data to identify trends that will influence future decisions.
Business Intelligence dashboards are critical to a business’ success. A Power BI dashboard offers unparalleled insights and analysis of key metrics and KPIs that other analytical tools do not provide. They come in useful when you need to present all data for one business function, department, or KPI in one place. The 3 types of dashboards that are available with Power BI are tailored to different levels of authority in the organization and rely on either real-time data or historical data. Operational dashboards are important to understand KPIs, metrics, and performance on a real-time basis on a single page. Strategic dashboards are designed to summarize performance over a set period of time and assess whether a company will meet its targets through the current strategies its employing with one glance. And analytical dashboards are effective in identifying and displaying trends that will likely impact the organization in the future using only historical data as its foundation. All 3 dashboards, however, are needed to keep a business on top of their key metrics and operating at peak performance in the future.


